Short answer: The five fraud metrics every security leader should track are loss rate, approval rate, false positive rate, chargeback rate, and exposure metrics (ATO attempts, bot traffic, and abuse signals). Together, they translate raw security events into the business outcomes that finance, fraud, and executive teams actually care about: revenue, customer experience, and risk exposure.
Below, we break down what each metric means, why it matters, and how it gives security and fraud teams a shared language instead of a shared argument.
It’s Monday morning, and four numbers are already on the screen before the executive review even starts: loss rate at 38 basis points, approval rate down 2%, customer contacts climbing on account takeover, and chargebacks rising. Fraud says approvals need to move without sacrificing accuracy. Security says controls need to tighten, or questions whether this is even theirs to own. The business wants fewer losses and more revenue, at the same time.
That’s the moment teams either talk past each other or start building the one thing that actually resolves it: a shared way to see the business.
Why Fraud Metrics Belong on a Security Leader’s Dashboard
Security and fraud are often run as separate functions, but fraud is frequently where security risk turns into a number the whole business can feel. Credential stuffing becomes account takeover. Bot traffic becomes promo abuse. Social engineering becomes chargebacks. Synthetic identities become onboarding fraud. Signal evasion means the fraud team often sees the impact of an attack without ever seeing its cause.
Attackers don’t organize their attacks around org charts. They move across identity, payments, and monetization in a single continuous path. Security typically spots the suspicious activity first, and fraud sees the monetized outcome later. Businesses that close that gap and start treating identity and fraud signals as one connected system are the ones that catch attacks earlier and make faster, better-informed decisions.
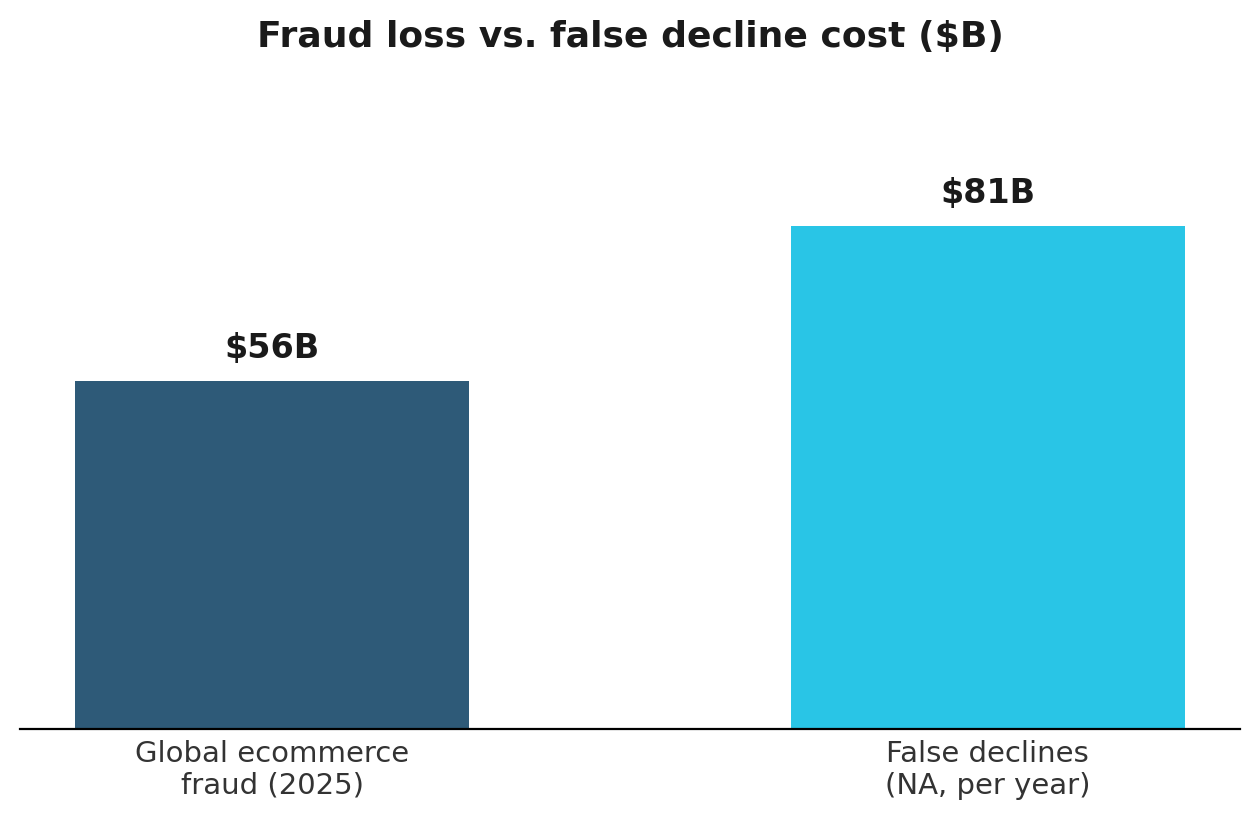
That starts with getting everyone measuring the same five things, and the stakes keep climbing. Global ecommerce fraud losses hit an estimated $56 billion in 2025 and are projected to more than double to $131 billion by 2030.1 A dashboard that only tracks security incidents will miss most of that trajectory.
Analyst research backs up the premise. Gartner has named this shift “cyber-fraud fusion” and projects that 20% of large enterprises will adopt fused fraud-and-cyber teams by 2028, up from under 5% today.8 The convergence this post describes isn’t a vendor talking point; it’s a trend a major analyst firm is actively tracking.
The Translation Problem: Why Security and Fraud Speak Different Languages
Security leaders and fraud teams aren’t disagreeing about the goal. They’re often using different metrics to describe the same problem.
| Term | What security hears | What fraud hears |
|---|---|---|
| False positives | Alert fatigue | Good customers blocked |
| Risk tolerance | Exposure threshold | Loss threshold |
| Control strength | Prevention rate | Approval impact |
| Incident rate | Attack volume | Fraud attempts |
| Success | Fewer events | Better business outcomes |
Security is built to reduce exposure. Fraud is built to optimize business outcomes. Neither view is wrong, but without a shared set of metrics, teams end up debating opinions instead of trade-offs.
| Metric | Data point | Source |
|---|---|---|
| CNP debit loss rate, 2019 | 26.1 bps | Federal Reserve Bank of Kansas City2 |
| CNP debit loss rate, 2023 | 41.6 bps | Federal Reserve Bank of Kansas City2 |
| Global ecommerce fraud losses, 2025 | $56 billion | Juniper Research1 |
| False declines lost annually, North America | $81 billion | PYMNTS Intelligence3 |
| Global average false decline rate | 1.51% | Datos Insights4 |
| Merchant self-reported false decline rate | 2% to 10% | Merchant Risk Council5 |
| US consumer ATO fraud losses, 2024 | $16 billion (+18% YoY) | Javelin Strategy & Research6 |
The 5 Fraud Metrics Every Security Leader Should Know
1. Loss Rate
What it measures: Fraud losses as a share of total transaction volume, usually expressed in basis points.
Formula:
Loss Rate = (Total Fraud Losses / Total Transaction Volume) × 10,000 = Basis Points
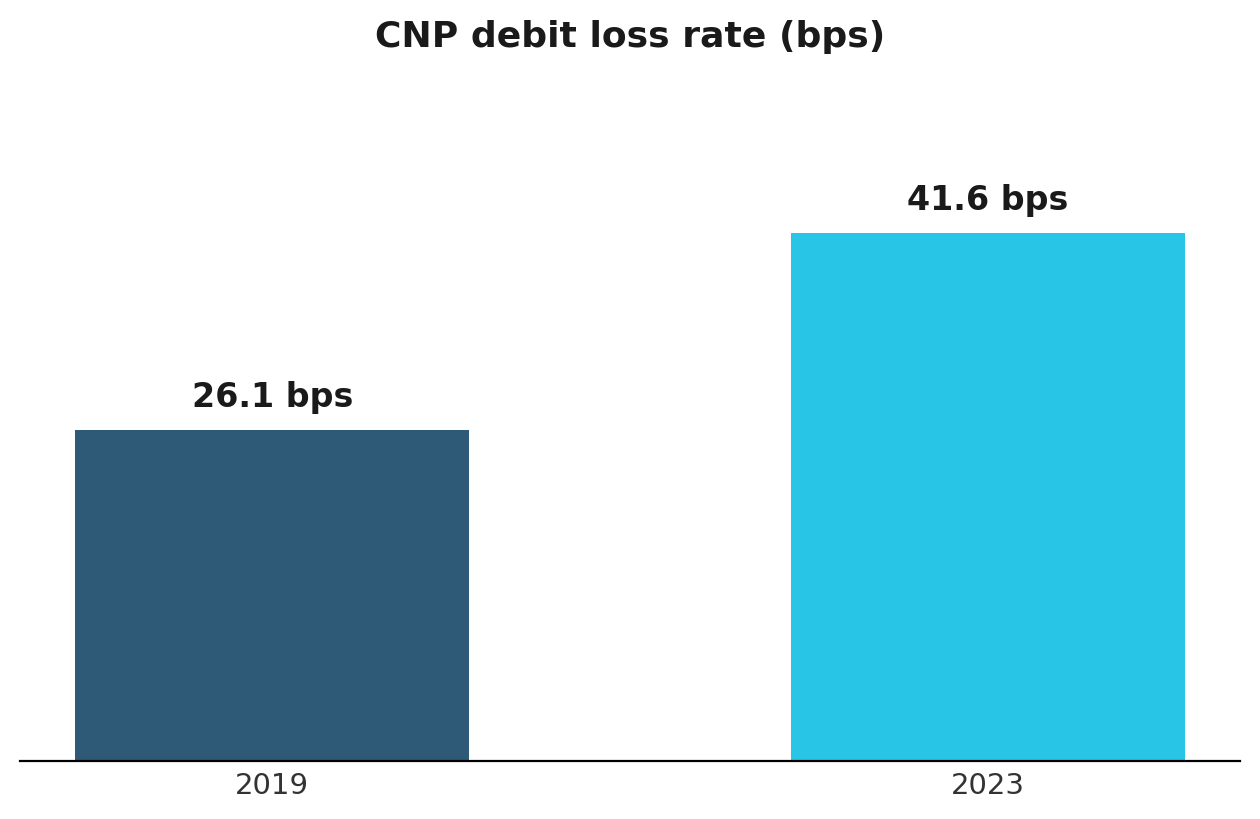
Benchmark: The average card-not-present fraud rate on U.S. debit cards climbed from 26.1 basis points in 2019 to 41.6 basis points in 2023.2 Separately, the Association of Certified Fraud Examiners estimates that the typical organization loses about 5% of annual revenue to occupational fraud broadly — a different (and much wider) scope than transaction-level loss rate, but a useful reminder of how large fraud’s total footprint can get once it’s measured end to end.9
What a spike signals: A rising loss rate with a stable approval rate usually means an attack pattern has changed faster than the rules keeping pace with it, such as a new bust-out ring or a synthetic identity cluster that’s cleared onboarding checks. A rising loss rate alongside a falling approval rate is a different problem: controls are tightening, but not on the right signals.
Security translation: Security talks in terms of severity. Fraud talks in basis points. Both are describing the same risk.
How it connects: Loss rate tells you the damage after the fact. Approval rate tells you what it cost to prevent it.
2. Approval Rate
What it measures: The percentage of attempted transactions or account actions that are approved.
Formula:
Approval Rate = (Approved Transactions / Total Attempted Transactions) × 100
Benchmark: False declines are estimated to cost North American ecommerce merchants roughly $81 billion a year in permanently lost sales.3
What a drop signals: A falling approval rate with a flat loss rate usually means rules have been tuned too conservatively, turning away good customers without a corresponding drop in fraud. A falling approval rate alongside a falling loss rate can be healthy — evidence that better signals are replacing blunt declines, not just adding more of them.
Security translation: Reducing risk shouldn’t come at the cost of unnecessary customer friction.
How it connects: Every decline that improves loss rate has a false-positive cost somewhere. The next metric is where that cost actually shows up.
3. False Positive Rate
What it measures: The share of blocked, challenged, or declined activity that turns out to be legitimate.
Formula:
False Positive Rate = (Legitimate Customers Declined / Total Declined) × 100
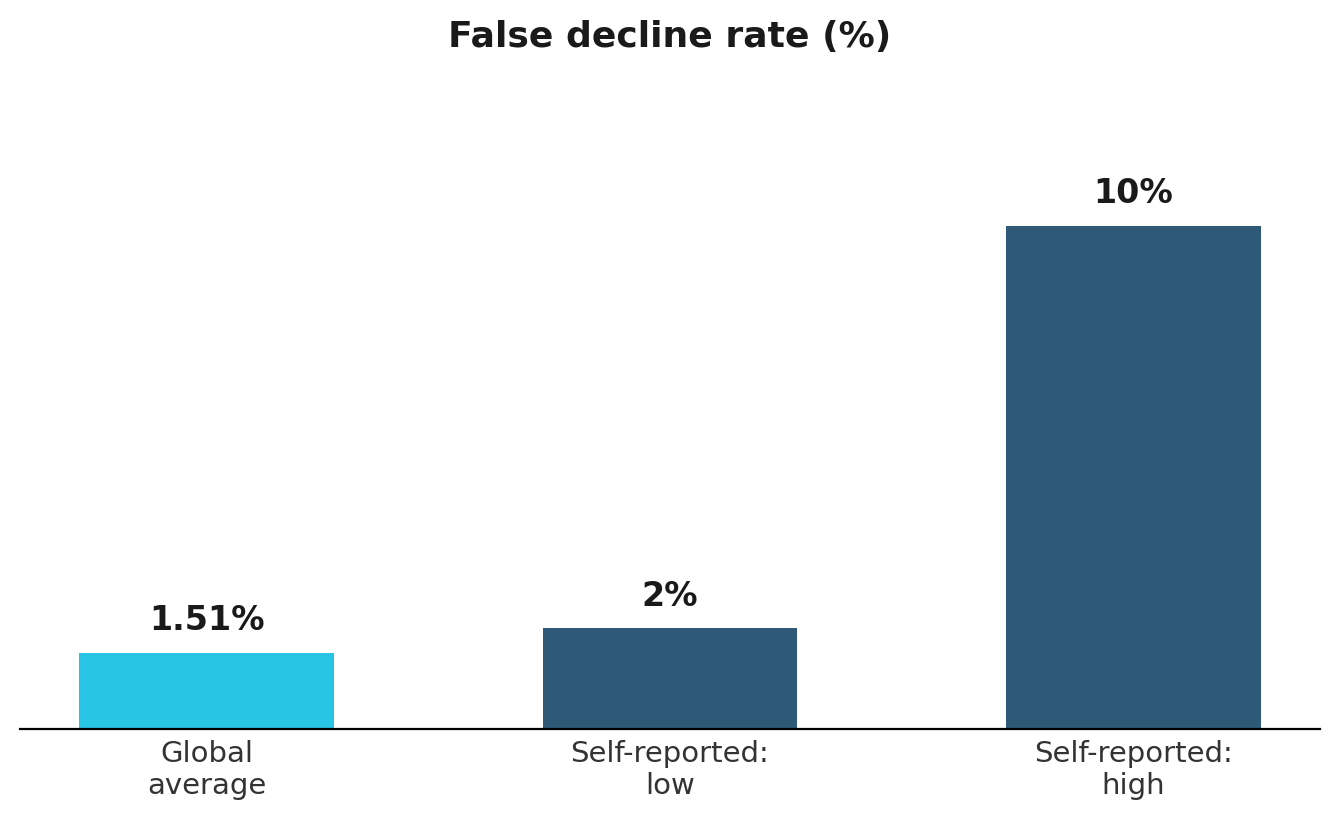
Benchmark: The global average false decline rate runs around 1.51% of ecommerce sales,4 though roughly two-thirds of merchants self-report a rate between 2% and 10% of orders.5 The gap between those numbers is itself a signal: peer-reviewed research analyzing bank decline data found that, on average, only 1 in 5 blocked transactions was actually fraudulent — meaning roughly 80% of declines in the systems studied were false positives.10
What a high rate signals: A high false positive rate paired with a healthy loss rate usually means rules are overfit to catch a small number of fraud patterns at a large cost to good customers. It’s the clearest sign that a program is optimizing for the wrong side of the approval-rate/loss-rate trade-off.
Security translation: Every control carries a customer cost.
How it connects: False positives are the hidden price of the approval and loss numbers above. Chargebacks are what happens when a program under-corrects instead.
4. Chargeback Rate
What it measures: Disputed transactions as a share of total transaction volume in a given period.
Formula:
Chargeback Rate = (Chargebacks in Period / Transactions in Period) × 100
Benchmark: Visa and Mastercard use different monitoring methodologies, and the distinction matters for merchants. Visa’s Acquirer Monitoring Program (VAMP) combines fraud reports and non-fraud disputes into a single ratio against settled transactions; its “Excessive” merchant threshold was updated from 2.2% to 1.5% (150 basis points) as of April 1, 2026, for merchants in the US, Canada, the EU, and Asia-Pacific. Latin America had already moved to the 1.5% threshold in April 2025.11 Mastercard’s Excessive Chargeback Merchant (ECM) program focuses on chargebacks as a share of transactions, triggering at 1.5% and more than 100 chargebacks in a calendar month, with the High Excessive tier beginning at 3% and 300+ chargebacks.12 Because each program measures risk through a different lens, merchants need to monitor both network-specific requirements to understand where additional action may be needed.
What a rise signals: Chargebacks are a lagging indicator. A rise usually reflects something that already happened upstream — account takeover, social engineering, customer confusion, or operational friction — so the fix is rarely found in the chargeback data itself.
Security translation: Chargebacks tell you what happened, not necessarily why.
How it connects: Chargebacks confirm that a threat got through. Exposure metrics are how you would have seen it coming.
5. Exposure Metrics (ATO, Bots, and Abuse Signals)
What it measures: Threat activity that predicts future fraud loss before it hits the books. This isn’t a single number; it’s three component sub-metrics tracked together.
Formulas:
ATO Attempt Rate = ATO Attempts / Total Login Attempts
Credential Stuffing Volume = Unique IP/Credential Pairs Tested per Hour
Bot Traffic Ratio = Bot Sessions / Total Sessions
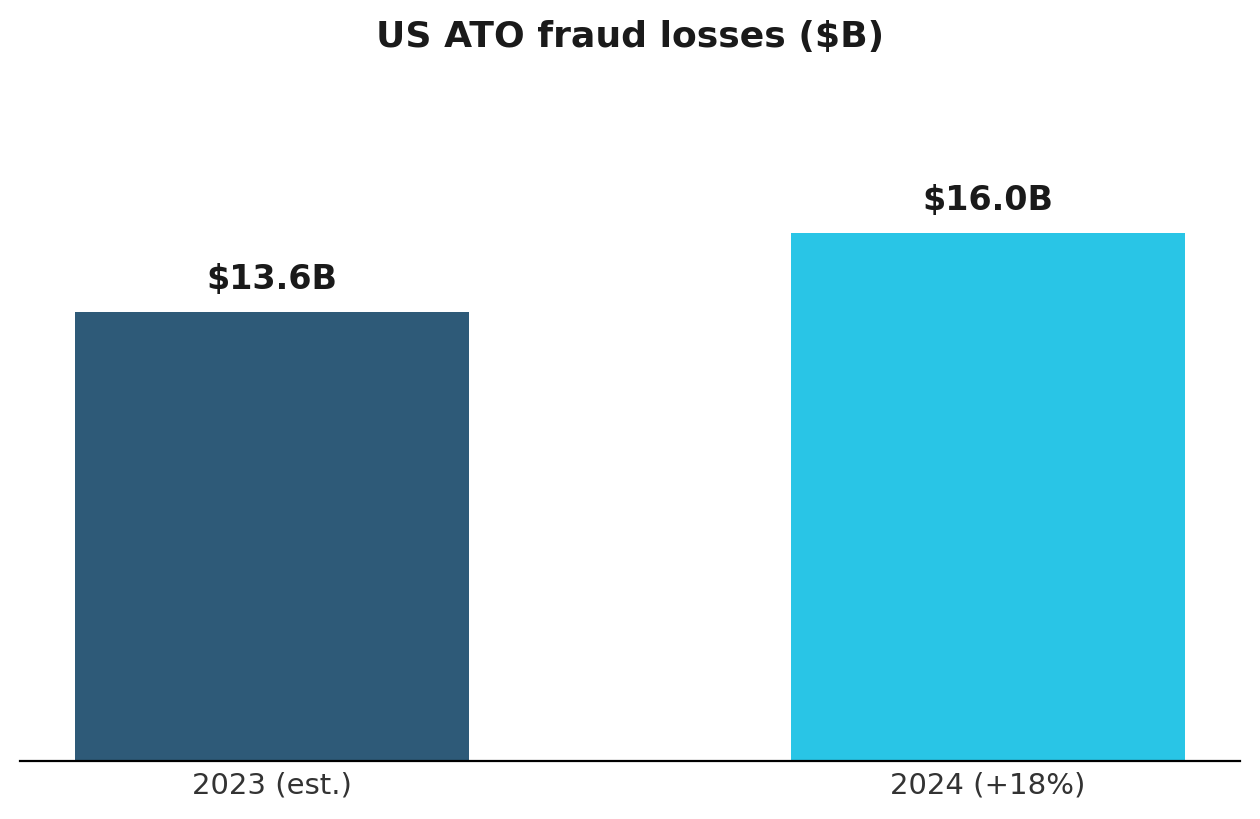
Benchmark: U.S. consumers lost close to $16 billion to account takeover fraud in 2024, an 18% jump year over year affecting several million individuals.6 Credential stuffing and bot-driven login abuse are widely reported as running at industrial scale across the industry, which is precisely why tracking rate and ratio, not raw volume, is what makes the signal usable.
What a spike signals: Rising exposure metrics with stable loss and chargeback numbers mean attack pressure is building faster than it’s converting to losses yet — an early warning worth acting on before the other four metrics move. If exposure metrics and losses rise together, the gap between detection and response has already closed against you.
Security translation: This is your threat landscape, quantified.
How it connects: Exposure metrics are the leading indicator for everything above. A rise here is the earliest point where security and fraud teams can act together, before it becomes a loss-rate, approval-rate, or chargeback problem.
The 5 Fraud Metrics at a Glance
| Metric | Formula | Red flag threshold | What it signals |
|---|---|---|---|
| Loss Rate | Fraud losses / transaction volume (bps) | Sustained upward trend vs. prior period | Attack volume rising or controls falling behind |
| Approval Rate | Approved / attempted transactions | Falling with flat or falling loss rate | Over-aggressive controls, not better ones |
| False Positive Rate | Legitimate declines / total declines | Materially above your own historical baseline | Rules overfit to a narrow fraud pattern |
| Chargeback Rate | Chargebacks / transactions | 1.5% combined ratio (Visa VAMP); 1.5% + 100/mo (Mastercard ECM) | Upstream fraud or operational failure, already happened |
| Exposure Metrics | ATO attempts, bot sessions, stuffing volume, each as a rate | Rising faster than historical baseline | Attack pressure building before losses appear |
Why These Five Metrics Only Work Together
No single metric tells the whole story:
- Loss rate measures financial impact
- Approval rate measures growth
- False positives measure customer friction
- Chargebacks reveal downstream consequences
- Exposure metrics signal what’s coming next
Viewed together, they give security leaders a balanced view spanning business performance, customer experience, and emerging risk. When exposure metrics rise, that pressure often flows downstream into higher account takeover complaints, softer approval rates, and eventually more chargebacks and losses. Watching any one metric in isolation can hide that pattern entirely. Watching all five as one connected system is what lets teams get ahead of it.
A Sixth Number Worth Tracking: The Precise Yes Score
The five metrics above tell you how your program is performing on its own. A newer benchmark, the Precise Yes Score, tells you how well fraud and security are performing together.
| Metric | Data point |
|---|---|
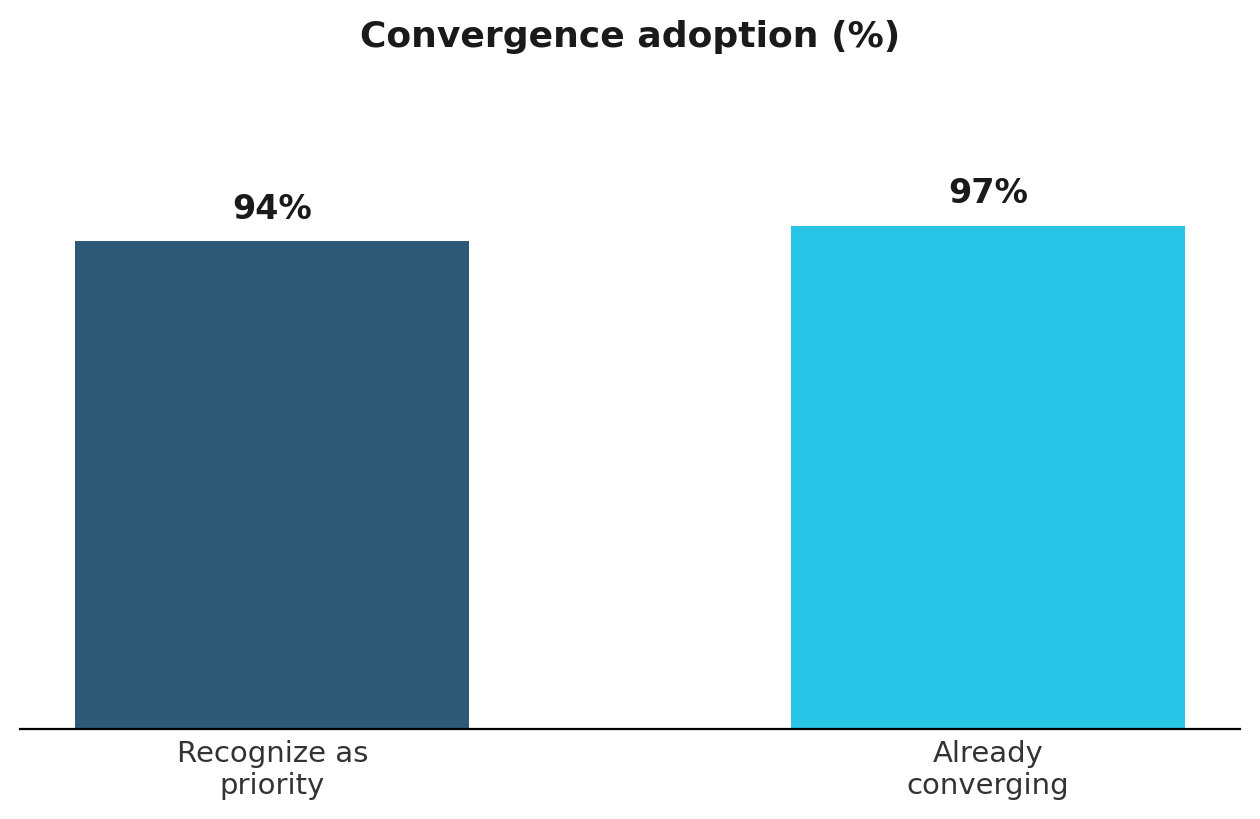
| Leaders who recognize convergence as a priority | 94% |
| Leaders already on a path to converge | 97% |
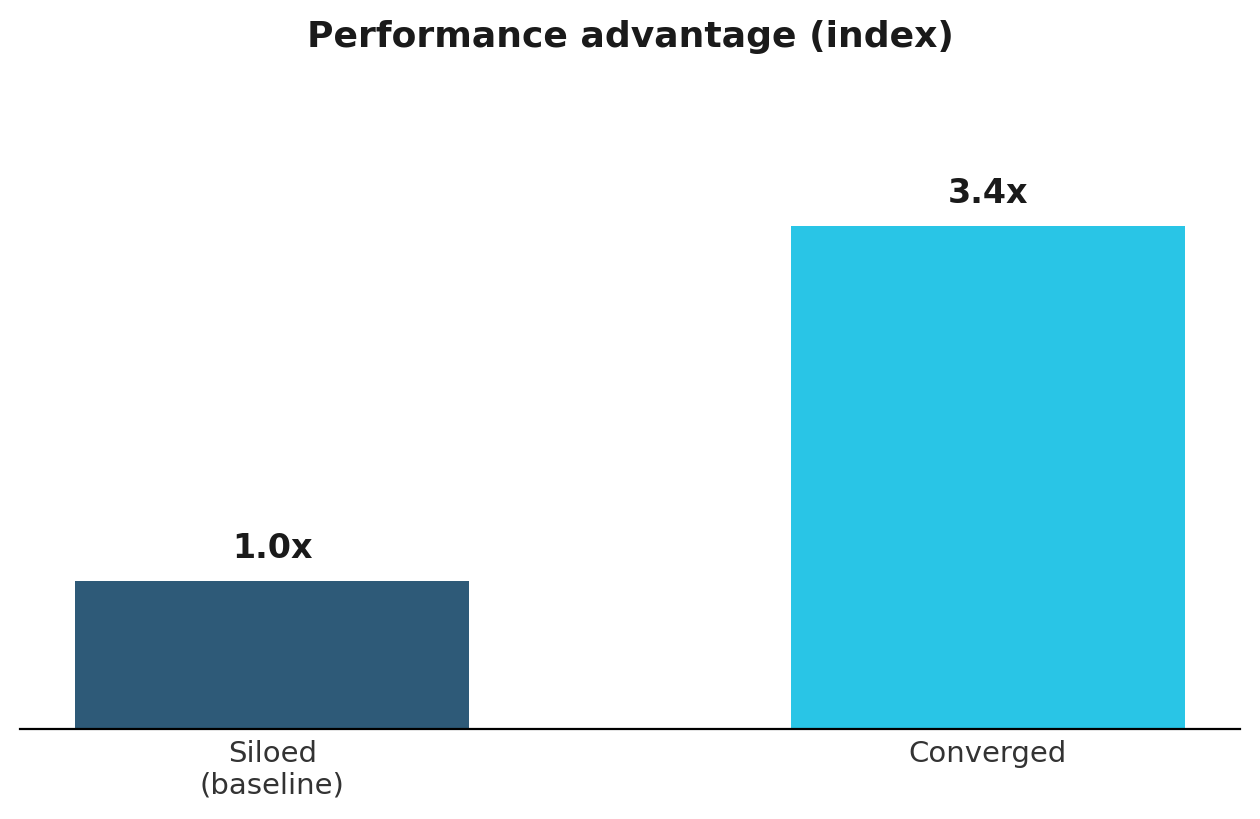
| Performance advantage, converged vs. siloed | 3.4x |
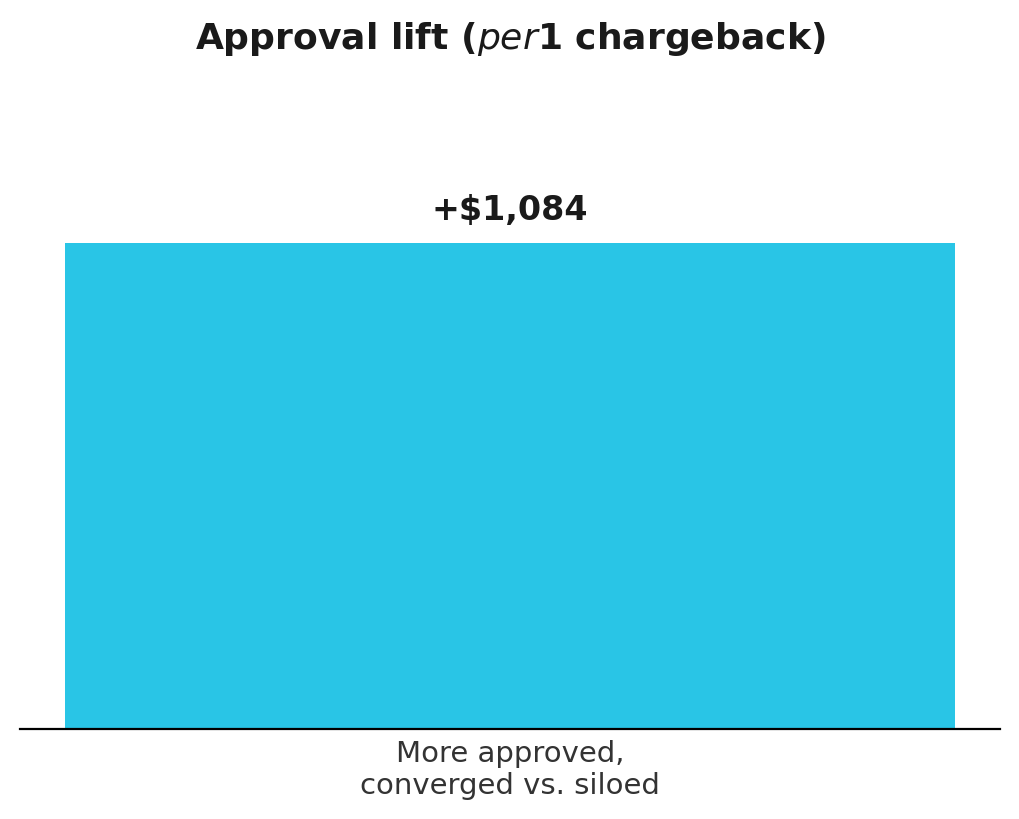
| More approved per $1 of fraud chargeback, converged vs. siloed | $1,084 |
Source: Accertify and Liminal, “The Convergence Dividend: Quantifying What Fraud-Cyber Convergence Actually Delivers,” July 2026.7
Precise Yes is defined as dollars approved for every $1 of fraud chargeback: a single number that captures how precisely an organization is saying “yes” to good customers while still controlling loss.7 A joint study of 250 director-level and above fraud, risk, and security leaders across retail, travel, restaurants and QSR, entertainment and media, and marketplaces used this metric to compare converged programs (where fraud and cyber teams share data, threat ownership, and reporting) against siloed ones.7
The findings make a strong case for using Precise Yes Score alongside the five metrics above:
- Fully converged organizations approved $1,084 more per dollar of fraud chargeback than siloed organizations.7
- Organizations that adopted a specific set of converged behaviors saw a 3.4x performance advantage over siloed peers.7
- 94% of surveyed leaders already recognize fraud-cyber convergence as a priority, and 97% report their organization is already on a path toward it.7
The study also identified four operational behaviors tied to the strongest Precise Yes Scores, forming a simple maturity model security leaders can benchmark against:7
- Team structure. How fraud and cyber teams are organized relative to each other.
- Shared use cases. Fraud and cyber teams jointly own two or more specific threat types.
- Data integration. Fraud and cyber signals feed into a single, shared pipeline rather than separate tools.
- Board governance. Fraud and cyber performance are reviewed together as a regular board-level agenda item.
How to Brief Executives on Fraud Metrics
Most executives don’t need a dozen dashboards. They need a clear answer to four questions:
- What are the current trends in loss rate, approval rate, chargebacks, and exposure metrics?
- What’s driving the movement?
- What actions are already underway?
- What business impact should leadership expect?
Clarity beats complexity every time. A briefing built around these five metrics gives fraud, security, and business leaders a common set of facts to make decisions from, not competing narratives to defend.
Frequently Asked Questions
What are the most important fraud metrics for security leaders to track?
The five core fraud metrics are loss rate, approval rate, false positive rate, chargeback rate, and exposure metrics (account takeover attempts, bot traffic, and abuse signals). Together they cover financial impact, growth, customer experience, and forward-looking risk.
What’s the difference between loss rate and chargeback rate?
Loss rate measures total fraud losses as a share of transaction volume. Chargeback rate measures disputed transactions specifically. Chargebacks are often a downstream symptom of fraud that already occurred, such as account takeover or social engineering, while loss rate captures the fuller financial picture.
Why do false positives matter in fraud prevention?
False positives represent legitimate customers who are blocked, challenged, or declined. They’re a hidden cost of overly aggressive fraud controls, showing up as abandoned carts, increased support volume, and lost customer trust. That’s why the strongest programs measure friction alongside fraud prevented.
How do security teams and fraud teams align on metrics?
Security teams traditionally focus on incidents, exposure, and time to detect and respond, while fraud teams focus on loss rate, approval and reject rates, chargebacks, and false positives. Alignment happens when both teams adopt a shared set of metrics, like the five outlined above, that connect threat activity to measurable business outcomes.
What are exposure metrics in fraud prevention?
Exposure metrics track threat activity that predicts future fraud losses, including account takeover (ATO) attempt rates, credential stuffing volume, bot traffic, and new-account abuse. They provide an early warning system before losses actually materialize in loss rate or chargeback numbers.
What’s the formula for fraud loss rate?
Loss rate is calculated as (Total Fraud Losses / Total Transaction Volume) × 10,000, expressed in basis points. At $1 billion in transaction volume, 38 basis points of loss equals $3.8 million.
How do I calculate loss rate?
Divide total fraud losses by total transaction volume for the same period, then multiply by 10,000 to express the result in basis points: Loss Rate = (Total Fraud Losses / Total Transaction Volume) × 10,000. For example, $3.8 million in fraud losses against $1 billion in transaction volume works out to 38 basis points. Basis points are the standard unit here because fraud loss rates are usually too small a percentage to compare easily at two decimal places; 0.038% is harder to scan and discuss than 38 bps.
What’s the difference between approval rate and authorization rate?
The two get used interchangeably, but they measure different decisions. Authorization rate is a payments metric: it’s the share of attempted transactions the card issuer approves at the network level, based on factors like available funds, card validity, and the issuer’s own risk rules, none of which the merchant controls directly. Approval rate, in a fraud context, measures the share of attempted transactions that clear the merchant’s own decisioning, which layers fraud screening on top of (or sometimes ahead of) that authorization step. A transaction can be authorized by the issuing bank and still get declined by the merchant’s fraud system, or held for manual review before authorization is ever requested. In short: authorization rate is what the bank allows; approval rate is what the business allows once its own fraud rules are factored in.
What’s a good chargeback rate threshold?
It depends on which card network you’re measuring against, and the two don’t define it the same way. Visa’s VAMP program combines fraud reports and non-fraud disputes into one ratio, with an “Excessive” merchant threshold of 1.5% as of April 2026.11 Mastercard’s Excessive Chargeback Merchant program uses a pure chargeback-to-transaction ratio, triggering at 1.5% plus more than 100 chargebacks in a month.12 A program can clear one network’s bar and still miss the other’s.
What is the Precise Yes Score?
The Precise Yes Score measures dollars approved for every $1 of fraud chargeback. It’s a single benchmark for how precisely an organization says “yes” to good customers while still controlling fraud loss, and it’s designed to be measured across fraud and security functions together rather than by either team alone.7
How do you measure the Precise Yes Score?
Divide total dollars approved by total dollars lost to fraud chargebacks over the same period. A joint study of 250 fraud, risk, and security leaders used this ratio to compare converged organizations (shared threat ownership, a common data platform, board-level visibility, and structural integration between fraud and cyber teams) against siloed ones, finding fully converged organizations approved $1,084 more per dollar of chargeback loss.7
What’s a good Precise Yes Score benchmark?
There’s no single universal target since it depends on industry, volume, and risk tolerance. What the research shows is that the gap between converged and siloed organizations is large: converged programs saw a 3.4x performance advantage, driven by four specific behaviors rather than budget size or headcount.7 The more useful benchmark is tracking your own Precise Yes Score over time as fraud and security move from separate metrics toward a shared one.
Footnotes
- Juniper Research, “Fraudulent eCommerce Transactions to Surpass $131 Billion by 2030,” February 2025. juniperresearch.com ↩
- Federal Reserve Bank of Kansas City, “Card-Not-Present Fraud Rates in the United States After the Migration to Chip Cards,” Payments System Research Briefing, 2025. kansascityfed.org ↩
- PYMNTS Intelligence, “eCommerce Firms Will Lose $81B to False Declines in 2023.” pymnts.com ↩
- Datos Insights (formerly Aite-Novarica Group), “E-Commerce Fraud Landscape and Trends: Merchants Seeking to Adapt.” datos-insights.com ↩
- Merchant Risk Council, “MRC Releases 2026 Global eCommerce Payments & Fraud Report.” merchantriskcouncil.org ↩
- Javelin Strategy & Research, “2025 Identity Fraud Study: Breaking Barriers to Innovation.” javelinstrategy.com ↩
- Accertify and Liminal, “The Convergence Dividend: Quantifying What Fraud-Cyber Convergence Actually Delivers,” July 2026. accertify.com ↩
- Gartner, “Emerging Tech: Security — Cyber-Fraud Fusion Is the Future of Online Fraud Detection,” Dan Ayoub and Pete Redshaw, September 7, 2023. gartner.com ↩
- Association of Certified Fraud Examiners, Occupational Fraud 2026: A Report to the Nations. acfe.com ↩
- “Reducing false positives in bank anti-fraud systems based on rule induction in distributed tree-based models,” ScienceDirect, citing Wedge et al. sciencedirect.com ↩
- Merchant Risk Council, “Stricter VAMP Ratio Thresholds Are Now in Effect. Here’s How to Stay Compliant,” reporting on Visa’s Acquirer Monitoring Program (VAMP). merchantriskcouncil.org ↩
- Mastercard, Rules for Merchants — Customer Compliance Program. mastercard.com ↩